Confusion matrix
Import ConfusionMatrix
from pandas_ml import ConfusionMatrix
Define actual values (y_true) and predicted values (y_pred)
y_true = ['rabbit', 'cat', 'rabbit', 'rabbit', 'cat', 'dog', 'dog', 'rabbit', 'rabbit', 'cat', 'dog', 'rabbit']
y_pred = ['cat', 'cat', 'rabbit', 'dog', 'cat', 'rabbit', 'dog', 'cat', 'rabbit', 'cat', 'rabbit', 'rabbit']
Let’s define a (non binary) confusion matrix
confusion_matrix = ConfusionMatrix(y_true, y_pred)
print("Confusion matrix:\n%s" % confusion_matrix)
You can see it
Predicted  cat  dog  rabbit  __all__
Actual
cat          3    0       0        3
dog          0    1       2        3
rabbit       2    1       3        6
__all__      5    2       5       12
Matplotlib plot of a confusion matrix
Inside a IPython notebook add this line as first cell
%matplotlib inline
You can plot confusion matrix using:
import matplotlib.pyplot as plt

confusion_matrix.plot()
If you are not using inline mode, you need to use to show confusion matrix plot.
plt.show()
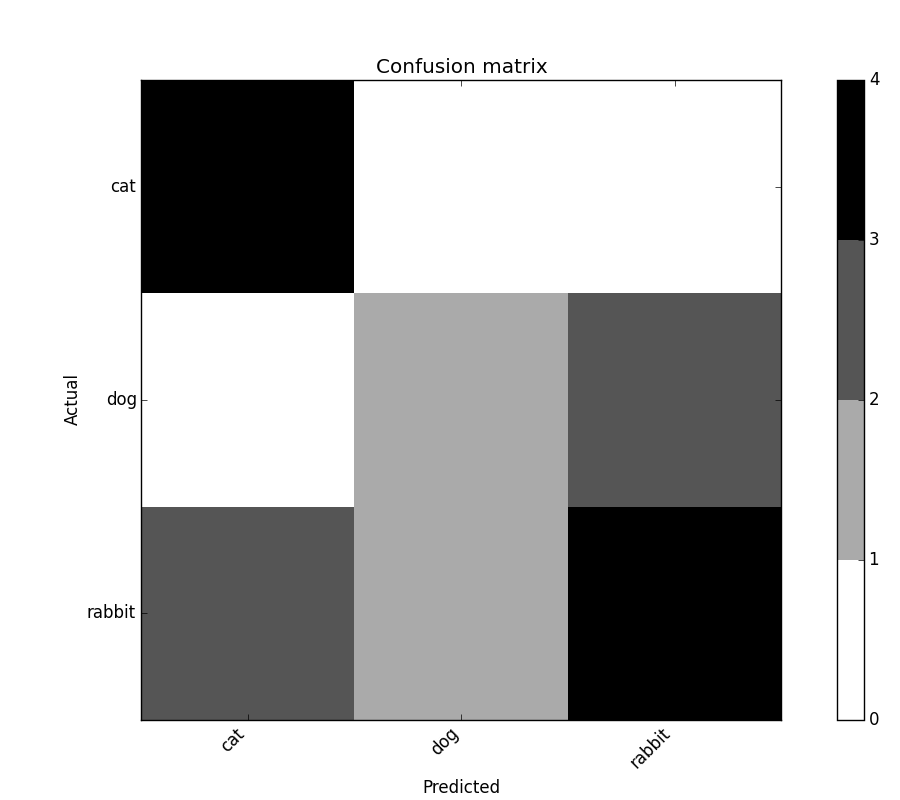
confusion_matrix
Matplotlib plot of a normalized confusion matrix
confusion_matrix.plot(normalized=True)
plt.show()
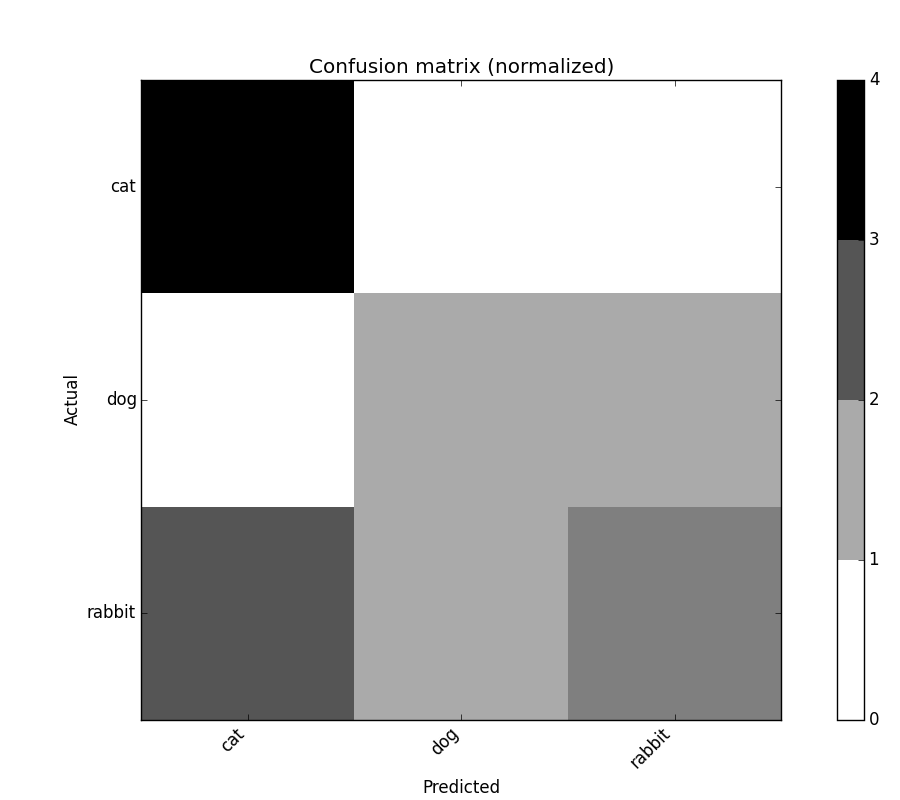
confusion_matrix_norm
Binary confusion matrix
If actual values (y_true) and predicted values (y_pred) are bool,
ConfusionMatrix outputs binary confusion matrix.
y_true = [ True,  True, False, False, False,  True, False,  True,  True,
           False,  True, False, False, False, False, False,  True, False,
            True,  True,  True,  True, False, False, False,  True, False,
            True, False, False, False, False,  True,  True, False, False,
           False,  True,  True,  True,  True, False, False, False, False,
            True, False, False, False, False, False, False, False, False,
           False,  True,  True, False,  True, False,  True,  True,  True,
           False, False,  True, False,  True, False, False,  True, False,
           False, False, False, False, False, False, False,  True, False,
            True,  True,  True,  True, False, False,  True, False,  True,
            True, False,  True, False,  True, False, False,  True,  True,
           False, False,  True,  True, False, False, False, False, False,
           False,  True,  True, False]

y_pred = [False, False, False, False, False,  True, False, False,  True,
       False,  True, False, False, False, False, False, False, False,
        True,  True,  True,  True, False, False, False, False, False,
       False, False, False, False, False,  True, False, False, False,
       False,  True, False, False, False, False, False, False, False,
        True, False, False, False, False, False, False, False, False,
       False,  True, False, False, False, False, False, False, False,
       False, False,  True, False, False, False, False,  True, False,
       False, False, False, False, False, False, False,  True, False,
       False,  True, False, False, False, False,  True, False,  True,
        True, False, False, False,  True, False, False,  True,  True,
       False, False,  True,  True, False, False, False, False, False,
       False,  True, False, False]

binary_confusion_matrix = ConfusionMatrix(y_true, y_pred)
print("Binary confusion matrix:\n%s" % binary_confusion_matrix)
It display as a nicely labeled Pandas DataFrame
Binary confusion matrix:
Predicted  False  True  __all__
Actual
False         67     0       67
True          21    24       45
__all__       88    24      112
You can get useful attributes such as True Positive (TP), True Negative (TN) …
print(binary_confusion_matrix.TP)
Matplotlib plot of a binary confusion matrix
binary_confusion_matrix.plot()
plt.show()
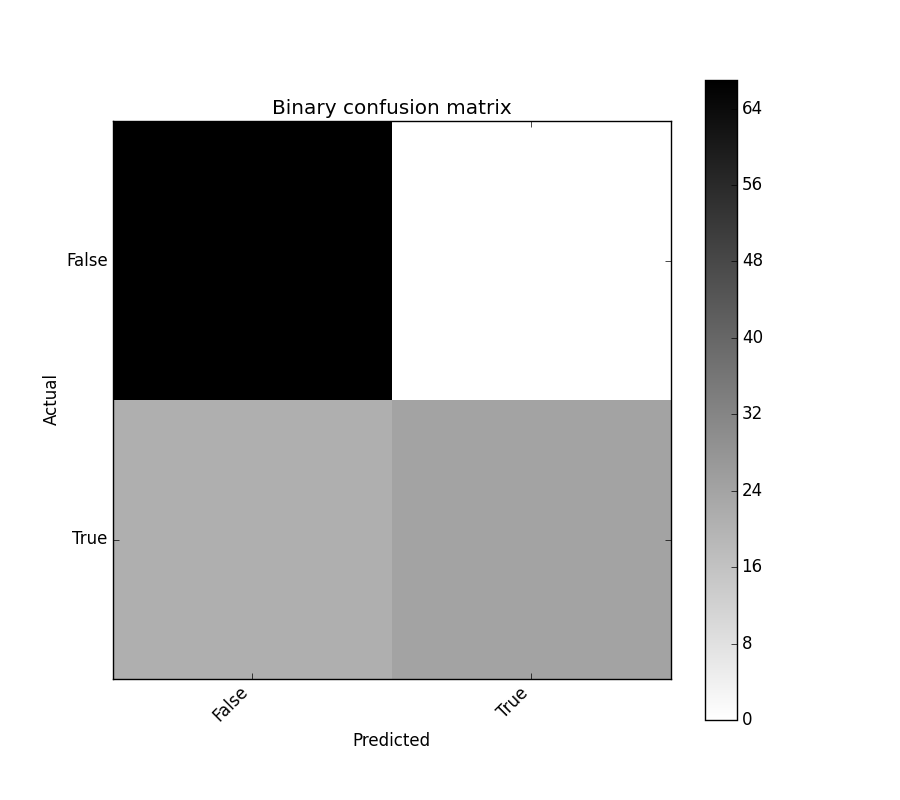
binary_confusion_matrix
Matplotlib plot of a normalized binary confusion matrix
binary_confusion_matrix.plot(normalized=True)
plt.show()

binary_confusion_matrix_norm
Seaborn plot of a binary confusion matrix (ToDo)
binary_confusion_matrix.plot(backend='seaborn')
Confusion matrix and class statistics
Overall statistics and class statistics of confusion matrix can be easily displayed.
y_true = [600, 200, 200, 200, 200, 200, 200, 200, 500, 500, 500, 200, 200, 200, 200, 200, 200, 200, 200, 200]
y_pred = [100, 200, 200, 100, 100, 200, 200, 200, 100, 200, 500, 100, 100, 100, 100, 100, 100, 100, 500, 200]
cm = ConfusionMatrix(y_true, y_pred)
cm.print_stats()
You should get:
Confusion Matrix:

Classes  100  200  500  600  __all__
Actual
100        0    0    0    0        0
200        9    6    1    0       16
500        1    1    1    0        3
600        1    0    0    0        1
__all__   11    7    2    0       20


Overall Statistics:

Accuracy: 0.35
95% CI: (0.1539092047845412, 0.59218853453282805)
No Information Rate: ToDo
P-Value [Acc > NIR]: 0.978585644357
Kappa: 0.0780141843972
Mcnemar's Test P-Value: ToDo


Class Statistics:

Classes                                 100         200         500   600
Population                               20          20          20    20
Condition positive                        0          16           3     1
Condition negative                       20           4          17    19
Test outcome positive                    11           7           2     0
Test outcome negative                     9          13          18    20
TP: True Positive                         0           6           1     0
TN: True Negative                         9           3          16    19
FP: False Positive                       11           1           1     0
FN: False Negative                        0          10           2     1
TPR: Sensivity                          NaN       0.375   0.3333333     0
TNR=SPC: Specificity                   0.45        0.75   0.9411765     1
PPV: Pos Pred Value = Precision           0   0.8571429         0.5   NaN
NPV: Neg Pred Value                       1   0.2307692   0.8888889  0.95
FPR: False-out                         0.55        0.25  0.05882353     0
FDR: False Discovery Rate                 1   0.1428571         0.5   NaN
FNR: Miss Rate                          NaN       0.625   0.6666667     1
ACC: Accuracy                          0.45        0.45        0.85  0.95
F1 score                                  0   0.5217391         0.4     0
MCC: Matthews correlation coefficient   NaN   0.1048285    0.326732   NaN
Informedness                            NaN       0.125   0.2745098     0
Markedness                                0  0.08791209   0.3888889   NaN
Prevalence                                0         0.8        0.15  0.05
LR+: Positive likelihood ratio          NaN         1.5    5.666667   NaN
LR-: Negative likelihood ratio          NaN   0.8333333   0.7083333     1
DOR: Diagnostic odds ratio              NaN         1.8           8   NaN
FOR: False omission rate                  0   0.7692308   0.1111111  0.05
Statistics are also available as an OrderedDict using:
cm.stats()